
Blog
Now, you have learned the different types of Japanese candlestick patterns — from basic and single to dual and triple. You have also learned how to combine them with other chart patterns, support and resistance, to make high-quality trading decisions. However, there is one more technical analysis tool that you should also learn to use. It is indicators.
There are many types of them, all of which we are going to touch upon. However, we will pare down our discussions to the most effective and widely used ones. Read on.
Introducing Technical Indicators
Technical indicators. You would have heard a lot about them. You might have even seen them in use, too. But have you seen how they are meant to be actually used? What are they? How do they actually work? Well, technical indicators are mathematical formulas. They are developed by traders who grow discontented with their use of the current ones, and think they should develop new ones. So, this means that you can develop yours, too.
All you will need to do that is to determine the exact type you want, the components to be included, the rules it will follow, and you will have a technical indicator of your own! That is, essentially, every technical indicator must have the following:
As mathematical formulas, technical indicators help traders in financial markets analyse historical data in order to predict price behaviour. As a result, they are used to determine entry and exit points for trades. But how exactly do they work?
First, technical indicators can be applied to any financial instrument as long as the instrument has historical price data. That is why, beyond Forex, they are also used in stock, commodities, and even fixed-income markets. However, no matter the particular market to which they are applied, they are most useful in the analyses of short-term price moves so they tend to work best for active, speculative traders.
Types of Technical Indicators
As far as technical indicators are concerned, hundreds of options are available to you. However, all these options can be grouped into four broad types, which are:
These types work in different ways but when combined can make a holistic whole. Before you start trading, here is a short guide on trend technical indicators.
Trend Technical Indicators
Trend Technical Indicators are designed to perform one role: to tell you the direction in which the market is moving. Also known as oscillators because they “oscillate” between high and low price data on charts, they are used to identify prevailing trends. That is, they are used to identify if the market is either going up or down. If you check your trading platform right now, you will notice that there are many such indicators.
However, the most widely used of them are:
How do these four trend technical indicators work? You will find out. Here, we are starting with the MACD.
Moving Average Convergence Divergence (MACD)
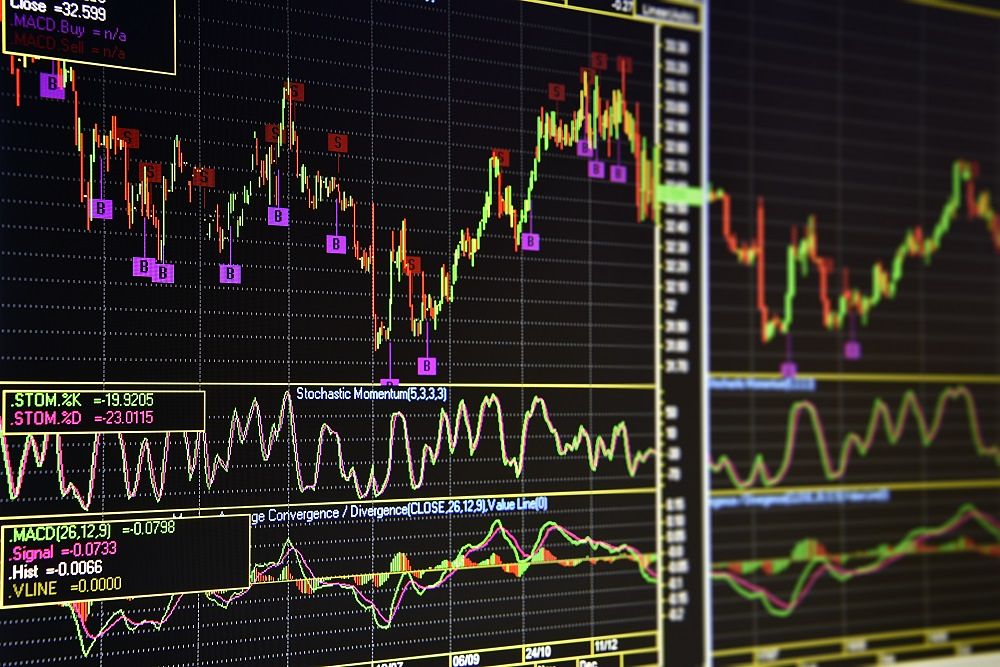
The Moving Average Convergence Divergence (MACD) technical indicator is made up of the three components: a fast line, a slow line, and a histogram. The inputs for the indicator, those data on which its movements are based, are a faster-moving average (MA-fast), a slower-moving average (MA-slow), and a period moving average (MA-period). While the MACD fast line represents the moving average of the difference between the MA-fast and the MA-slow, the MACD slow line is a moving average of the MA fast line.
The histogram, plotted together with the moving averages, stands for the difference between the MACD fast and slow lines. Now, say you have an MACD reading of “10, 24, 7.” This can be interpreted that the fast line is the moving average of the difference between the 10-period and the 24-period moving averages while the slow line is a 7-period moving average of the MACD fast line. The histogram, on the other hand, indicates the difference between the two MACD lines, the fast and slow lines. Then, so, how does the “convergence divergence” come about?
©TradingView.
Well, it does from the characteristic behaviour of the MACD fast and slow lines. The two lines cross each other from time to time. When they do and the difference between them is close, they are said to converge. Other times when the difference is wide, they are said to diverge. The lines coming together (that is, converging) is taken to mean that a new trend is being formed. When they cross over and start to diverge, a trend reversal is said to have occurred.
©TradingView.
Because its lines represent averages of other moving averages, the MACD is said to be a moving average of other moving averages. It is that feature that enables it to easily authenticate market directions. However, this indicator lags a lot because of that, indicating that it records only what has happened in the market. Consequently, it works better for the confirmation of trends and less for the identification of them.
Conclusion
Technical indicators are an invaluable Forex trading tool. They are mathematical formulas that can be used to predict price behaviour. They are not hard to create, meaning that almost any trader can create a custom one. Still, all technical indicators, old or novel, can be categorised into the four broad groups: trend, momentum, volume, and volatility.
Here, you have learned how to use the MACD, the first of the four trend technical indicators that we will be talking about. Hence, by now, you should be able to deploy it in your trading. For your benefit, our Forex signals are developed using a wide range of technical indicators and tools so you do not necessarily have to master the use of each. You can subscribe to them here.